5 AI-Assisted Model and Layout Generations
The ggsem AI Assistant provides two powerful methods for creating Structural Equation Models: generating model syntax from your data structure or from natural language descriptions. This feature makes SEM accessible to beginners while accelerating workflow for experienced researchers.
5.1 Getting Started: API Configuration
Before using AI features, you’ll need to configure API access:
5.1.1 Step-by-Step Setup:
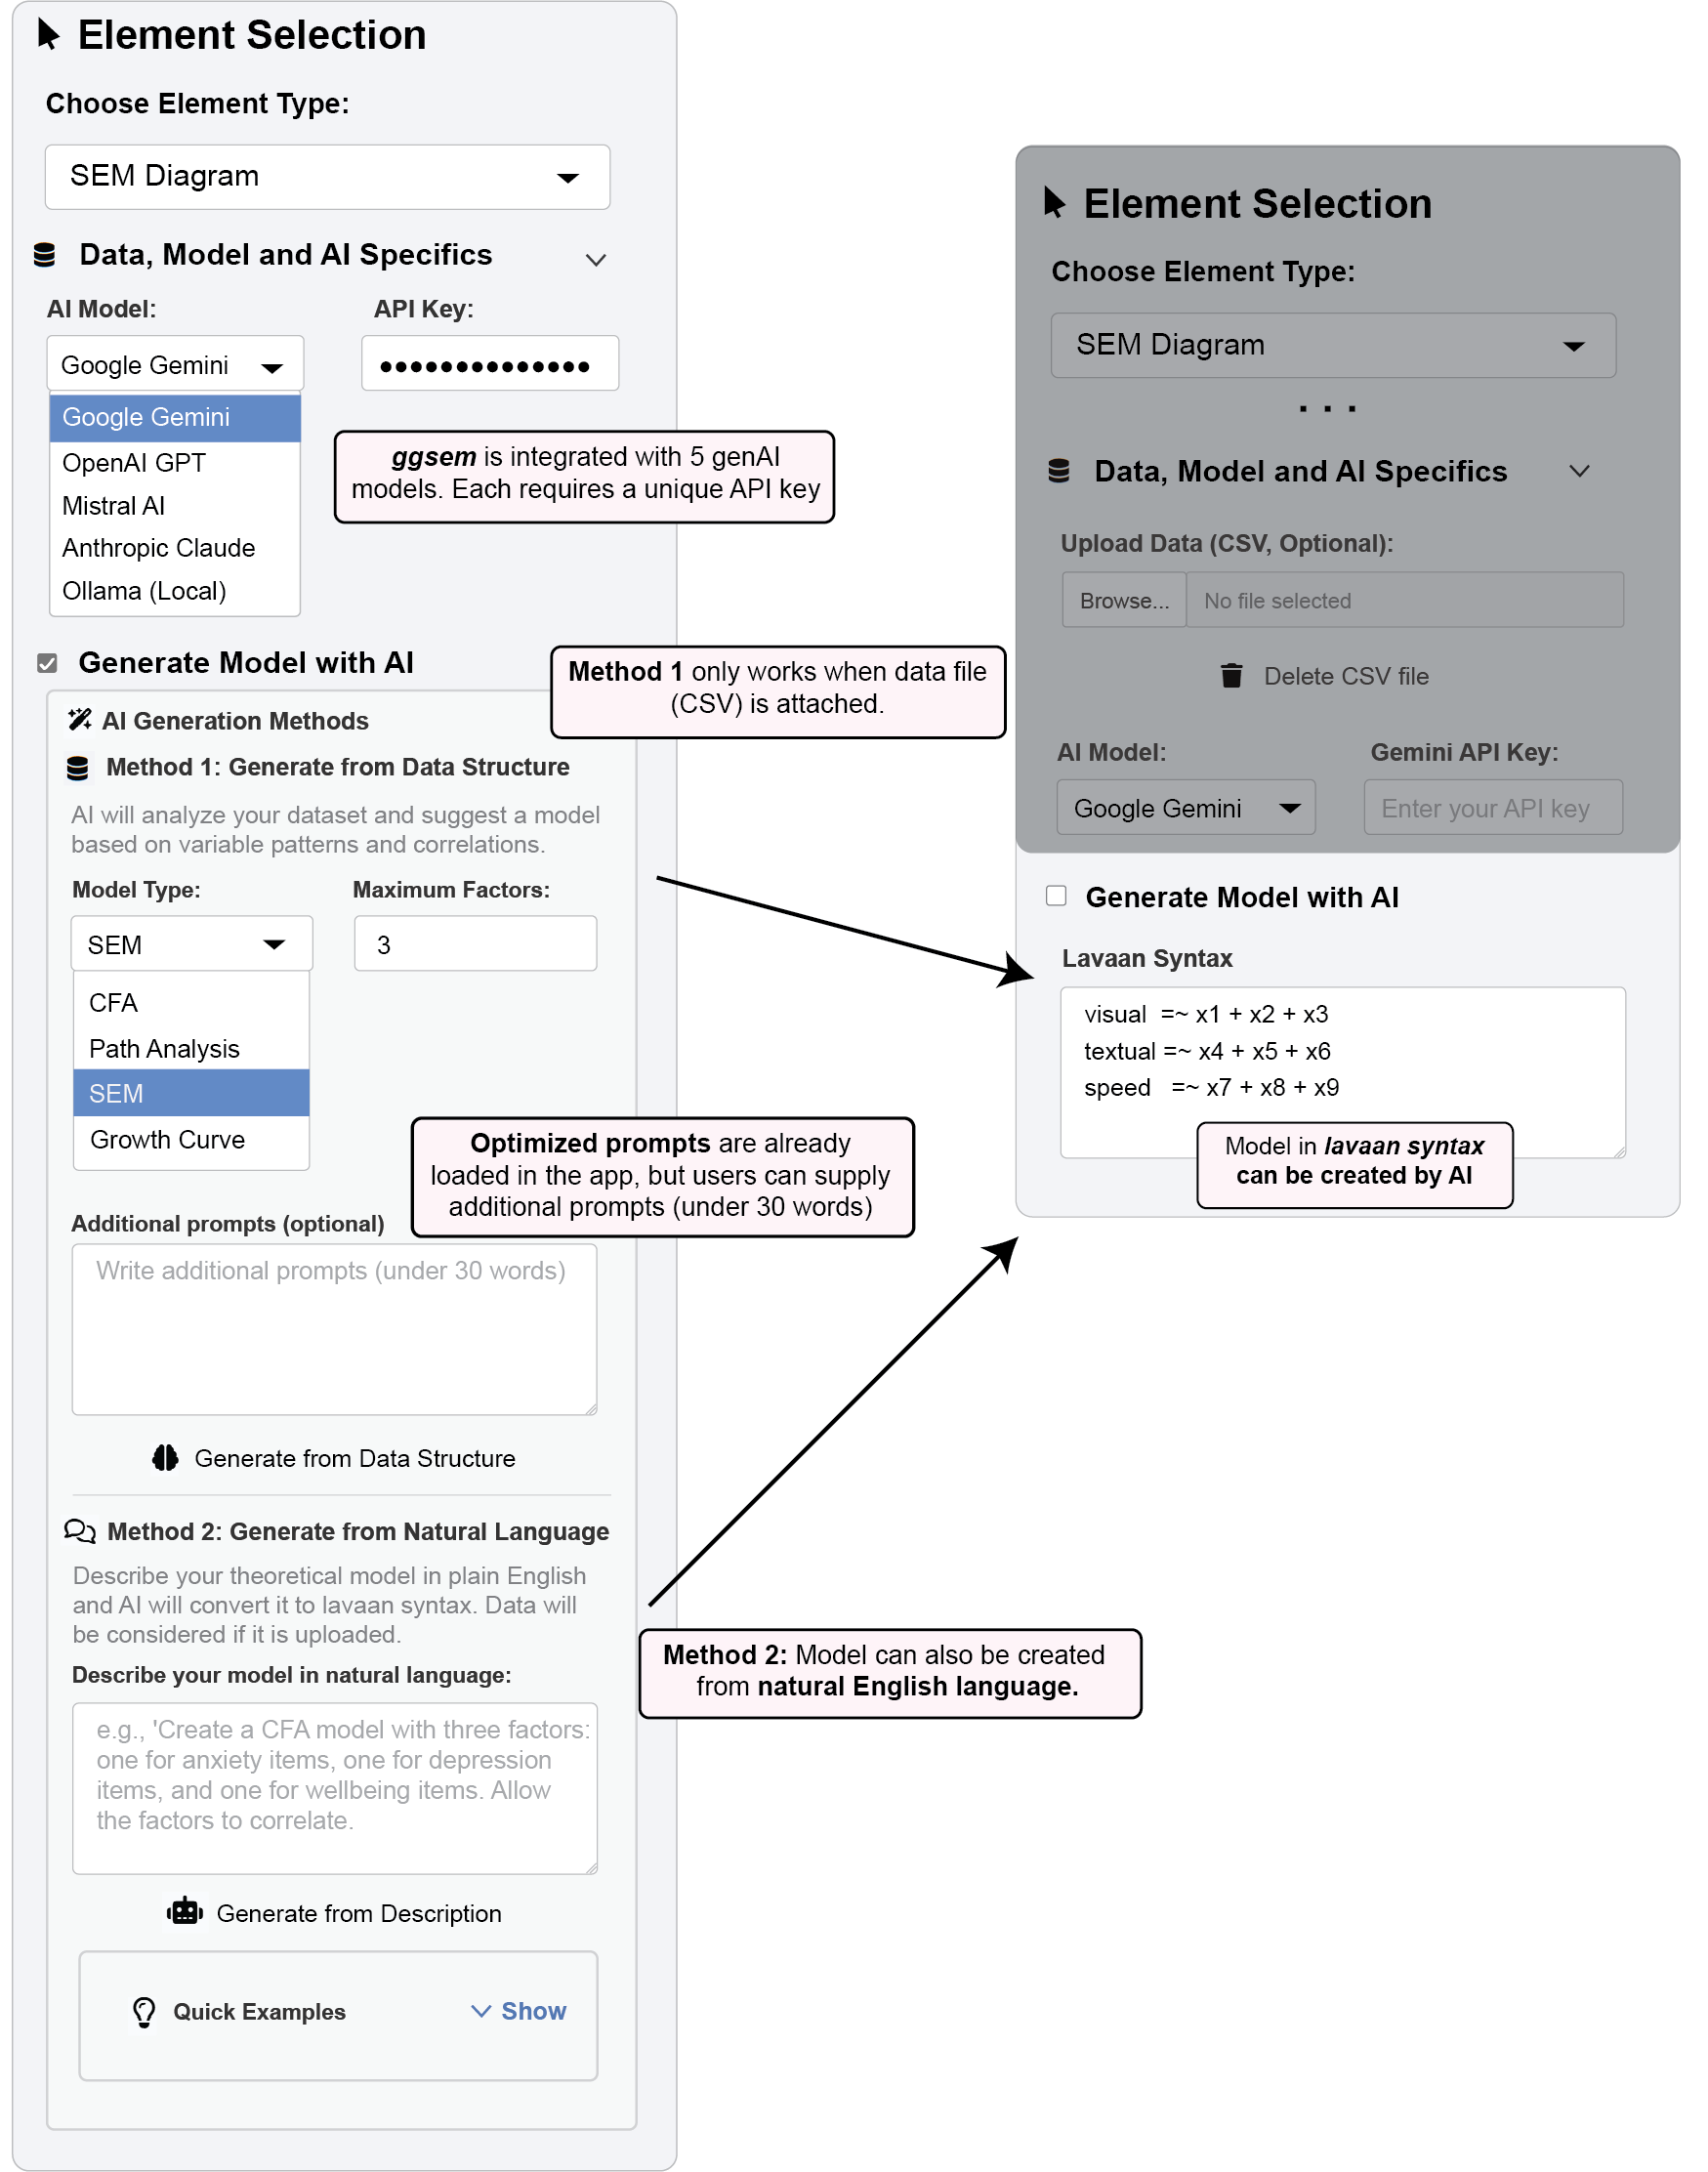
Navigate to the “Data, Model and AI Specifics” panel in the SEM Diagram section.
In the “AI Model” dropdown, select your preferred service:
- Google Gemini - Excellent for general SEM tasks
- OpenAI GPT - Strong with complex model descriptions
- Mistral AI - Balanced performance and efficiency
- Anthropic Claude - Advanced reasoning capabilities
- Ollama (Local) - Complete privacy with local processing
Configure API Settings
For Cloud Providers (Gemini, OpenAI, Mistral, Claude):
Locate the API key input field that appears after selecting your provider
Obtain your API key from the provider’s developer portal:
Google AI Studio: https://aistudio.google.com/
OpenAI Platform: https://platform.openai.com/api-keys
Mistral Platform: https://console.mistral.ai/
Anthropic Console: https://console.anthropic.com/
Paste your API key into the input field
For Ollama (Local):
Ensure Ollama is installed and running on your local machine (
ollama serve)Enter your preferred local model name (e.g., “llama2”, “mistral”, “codellama”)
No API key required for local operation
Verify Connection
The interface will indicate successful API configuration
Test by generating a simple model to confirm functionality
5.2 Two Methods for Generating Models
5.2.1 Method 1: Generate from Data Structure
This approach analyzes your dataset’s patterns to suggest theoretically plausible models. The AI examines correlations and variable relationships to propose appropriate factor structures.
5.2.1.1 Example 1A: Discovering Factor Structure
- Download the demonstration dataset or use pre-loaded sample data (
Holzinger & Swinefold) in the app:
demo_data <- read.csv('https://www.smin95.com/HolzingerSwineford1939.csv')If you have downloaded and uploaded the data in
ggsemapplication, click “Upload Data” and select your CSV file.Configure Parameters:
Choose model type: CFA, Path Analysis, SEM, or Growth
Set “Maximum Factors” to control model complexity (e.g., 3)
Add optional context in “Additional prompts” if needed
Execute: Click “Generate from Data Structure”
Sample Output:
The AI might generate syntax like:
# Measurement model for latent factors

# Factor 1: Specific Construct (x4, x5, x6 are highly correlated, suggesting a common underlying construct)
FactorA =~ x4 + x5 + x6

# Factor 2: Academic Development (ageyr and grade are correlated; agemo is also an age-related measure)
AcademicDevelopment =~ ageyr + grade + agemo

# Factor 3: Other Measured Items (remaining 'x' variables are grouped into a general factor)
FactorC =~ x1 + x2 + x3 + x7 + x8 + x9
Note: Outputs are non-deterministic - your results may vary as the AI explores different plausible structures.
5.2.2 Method 2: Generate from Natural Language
Describe your theoretical model in plain English and let the AI handle the technical syntax conversion.
Example 1B: Creating a Mediation Model
Ensure the HolzingerSwineford1939 dataset is loaded in the
ggsemapplication (the same CSV file as above).In the “Describe your model in natural language” input, write:
Create a structural model where visual ability (x1, x2, x3) influences
textual ability (x4, x5, x6) through a mediation of speed ability (x7, x8, x9).
Include direct effects from visual to textual and show all factor correlations.
Click “Generate From Description”. Output will be displayed in the textbox Lavaan Syntax.
Sample Output:
# Measurement model
visual_ability =~ x1 + x2 + x3
speed_ability =~ x7 + x8 + x9
textual_ability =~ x4 + x5 + x6

# Structural model: Visual ability influences Textual ability through Speed ability (mediation)
speed_ability ~ visual_ability          # Visual ability predicts Speed ability
textual_ability ~ speed_ability         # Speed ability predicts Textual ability

# Include direct effect from Visual ability to Textual ability
textual_ability ~ visual_ability        # Direct effect of Visual ability on Textual ability
5.2.2.1 Best Practices for Optimal Results:
Data Preparation (data are optional for Method 2):
Use meaningful variable names (the AI understands common psychological constructs)
Include adequate sample size (50+ cases for reliable pattern detection)
Remove irrelevant columns that might confuse the AI
Natural Language Tips:
Be specific about variable relationships
Use actual column names from your dataset
Clearly distinguish between measurement and structural models
Specify mediation or moderation when relevant
5.2.3 Troubleshooting & Management
5.2.3.1 Common Issues:
API Errors: Verify key has sufficient credits and correct permissions
Connection Problems: Check internet connectivity for cloud providers
Ollama Issues: Ensure service is running with
ollama serveSyntax Errors: Manually review and correct occasionally invalid syntax
5.2.3.2 Cost Management:
Start with free tiers (Gemini, OpenAI offer initial credits)
Monitor usage through your provider’s dashboard
Use Ollama for unlimited local processing
For large projects, estimate costs using provider calculators
5.2.3.3 Privacy Considerations:
Local Processing: Ollama keeps all data on your machine
API Policies: Review cloud providers’ data handling policies
Sensitive Data: Use Ollama or anonymize variables before upload
Session Security: API keys clear when you close the app
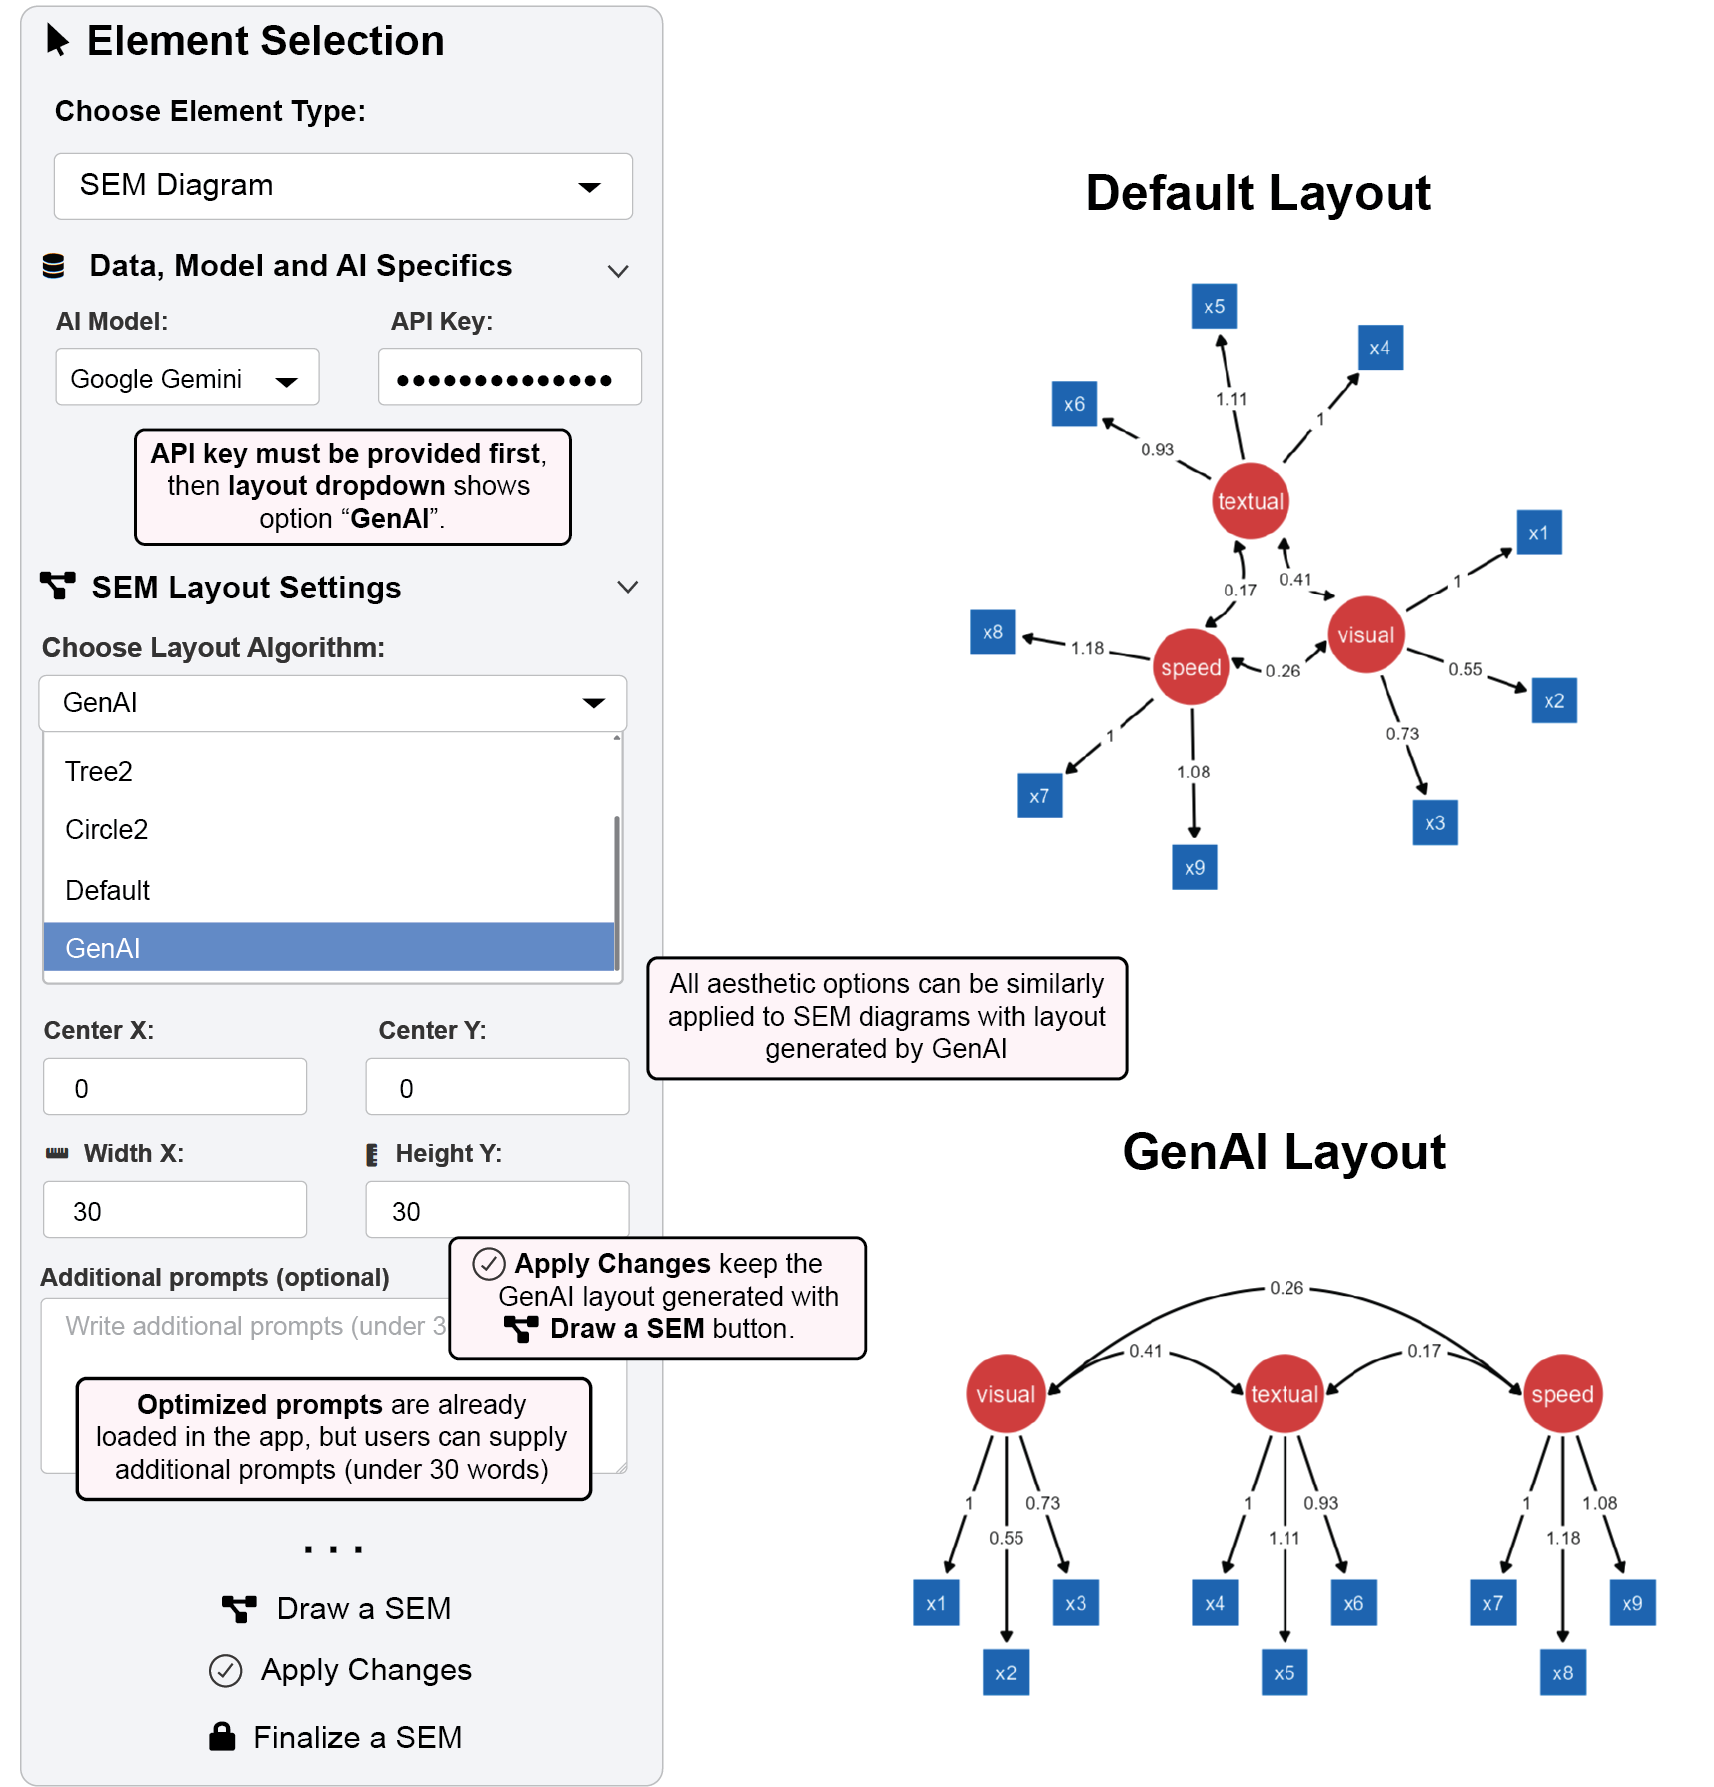
5.3 AI-Powered Layout Generation
The GenAI layout feature uses artificial intelligence to automatically generate optimal visual arrangements for your SEM diagrams, potentially creating fresh layouts compared to traditional algorithms.
5.3.0.1 Example 2: Generating an AI-Optimized Layout
Step 1: Configure API Access
In the SEM Diagram section, open the “Data, Model and AI Specifics” panel.
Select your preferred AI provider (e.g., Google Gemini, OpenAI GPT) from the “AI Model” dropdown.
- In this example, Google Gemini is used because it is free.
Enter your valid API key in the provided field.
Once configured, the “GenAI” option will become available in the layout dropdown.
Step 2: Load Your Data and Model
Upload your dataset: Click “Upload Data” and select your CSV file (same as above), or ensure your data is already loaded.
Specify your model: Enter or verify your
lavaansyntax in the “Lavaan Syntax” input area.Use either AI-generated or custom lavaan syntax:
Visual =~ x1 + x2 + x3
Textual =~ x4 + x5 + x6
Speed =~ x7 + x8 + x9
Step 3: Generate the GenAI Layout
Navigate to the “SEM Layout Settings” panel.
From the “Choose Layout Algorithm” dropdown, select “GenAI”.
- Set Width X and Height Y as 30 (see Figure 2).
(Optional) In the “Additional prompts for layout” text box, you can provide extra context in under 30 words to guide the AI (e.g., “Place the central latent variable at the top”). Note: The app uses optimized default prompts, so additional input is optional.
Click the “Draw a SEM” button. The AI will generate and render a novel layout for your diagram. Important: GenAI layouts are non-deterministic. Running it again will likely produce a different arrangement.
Step 4: Customize the Aesthetics
- Modify aesthetic settings in the Node Settings, Edge Settings, and Annotation Settings panels to modify colors, shapes, fonts, and other visual properties. * All standard aesthetic controls work identically on GenAI-generated layouts.
Step 5: Apply and Lock Your Customizations
12. Click the “Apply Changes” button to update the diagram with your new aesthetics. * This action preserves the GenAI-generated layout and only modifies the visual styles. It does not trigger a re-creation of the layout.
- Once satisfied, click “Finalize a SEM” to lock the diagram and prevent further changes to the layout and aesthetics via the SEM menu.
5.3.1 Key Features of GenAI Layout:
Non-deterministic: Each generation may produce different but equally valid layouts
Context-aware: AI considers variable names and model structure
Optimized spacing: Automatically balances element placement and connection clarity