ggsem: Reproducible Visualization of SEM and Related Models in R
Preface
Welcome to the ggsem tutorial book!
Creating clear, publication-ready visualizations for structural models remains a practical bottleneck. While model estimation, comparison, and inference are well supported, translating fitted models into comparative figures—especially for multi-group SEM or networks or combined—often requires manual post-hoc editing that is difficult to reproduce and audit.
The ggsem package provides a visualization framework that operates directly on fitted statistical models. Rather than treating diagrams as collections of graphical primitives, ggsem links visual elements—nodes, paths, labels, and self-loops—to the underlying model parameters they represent. Visual refinements therefore reference parameter identity and group structure defined in the statistical model, while leaving the model specification and estimation unchanged.
Here are some examples of multi-group SEM diagrams and networks generated with ggsem (see Chapter 1).
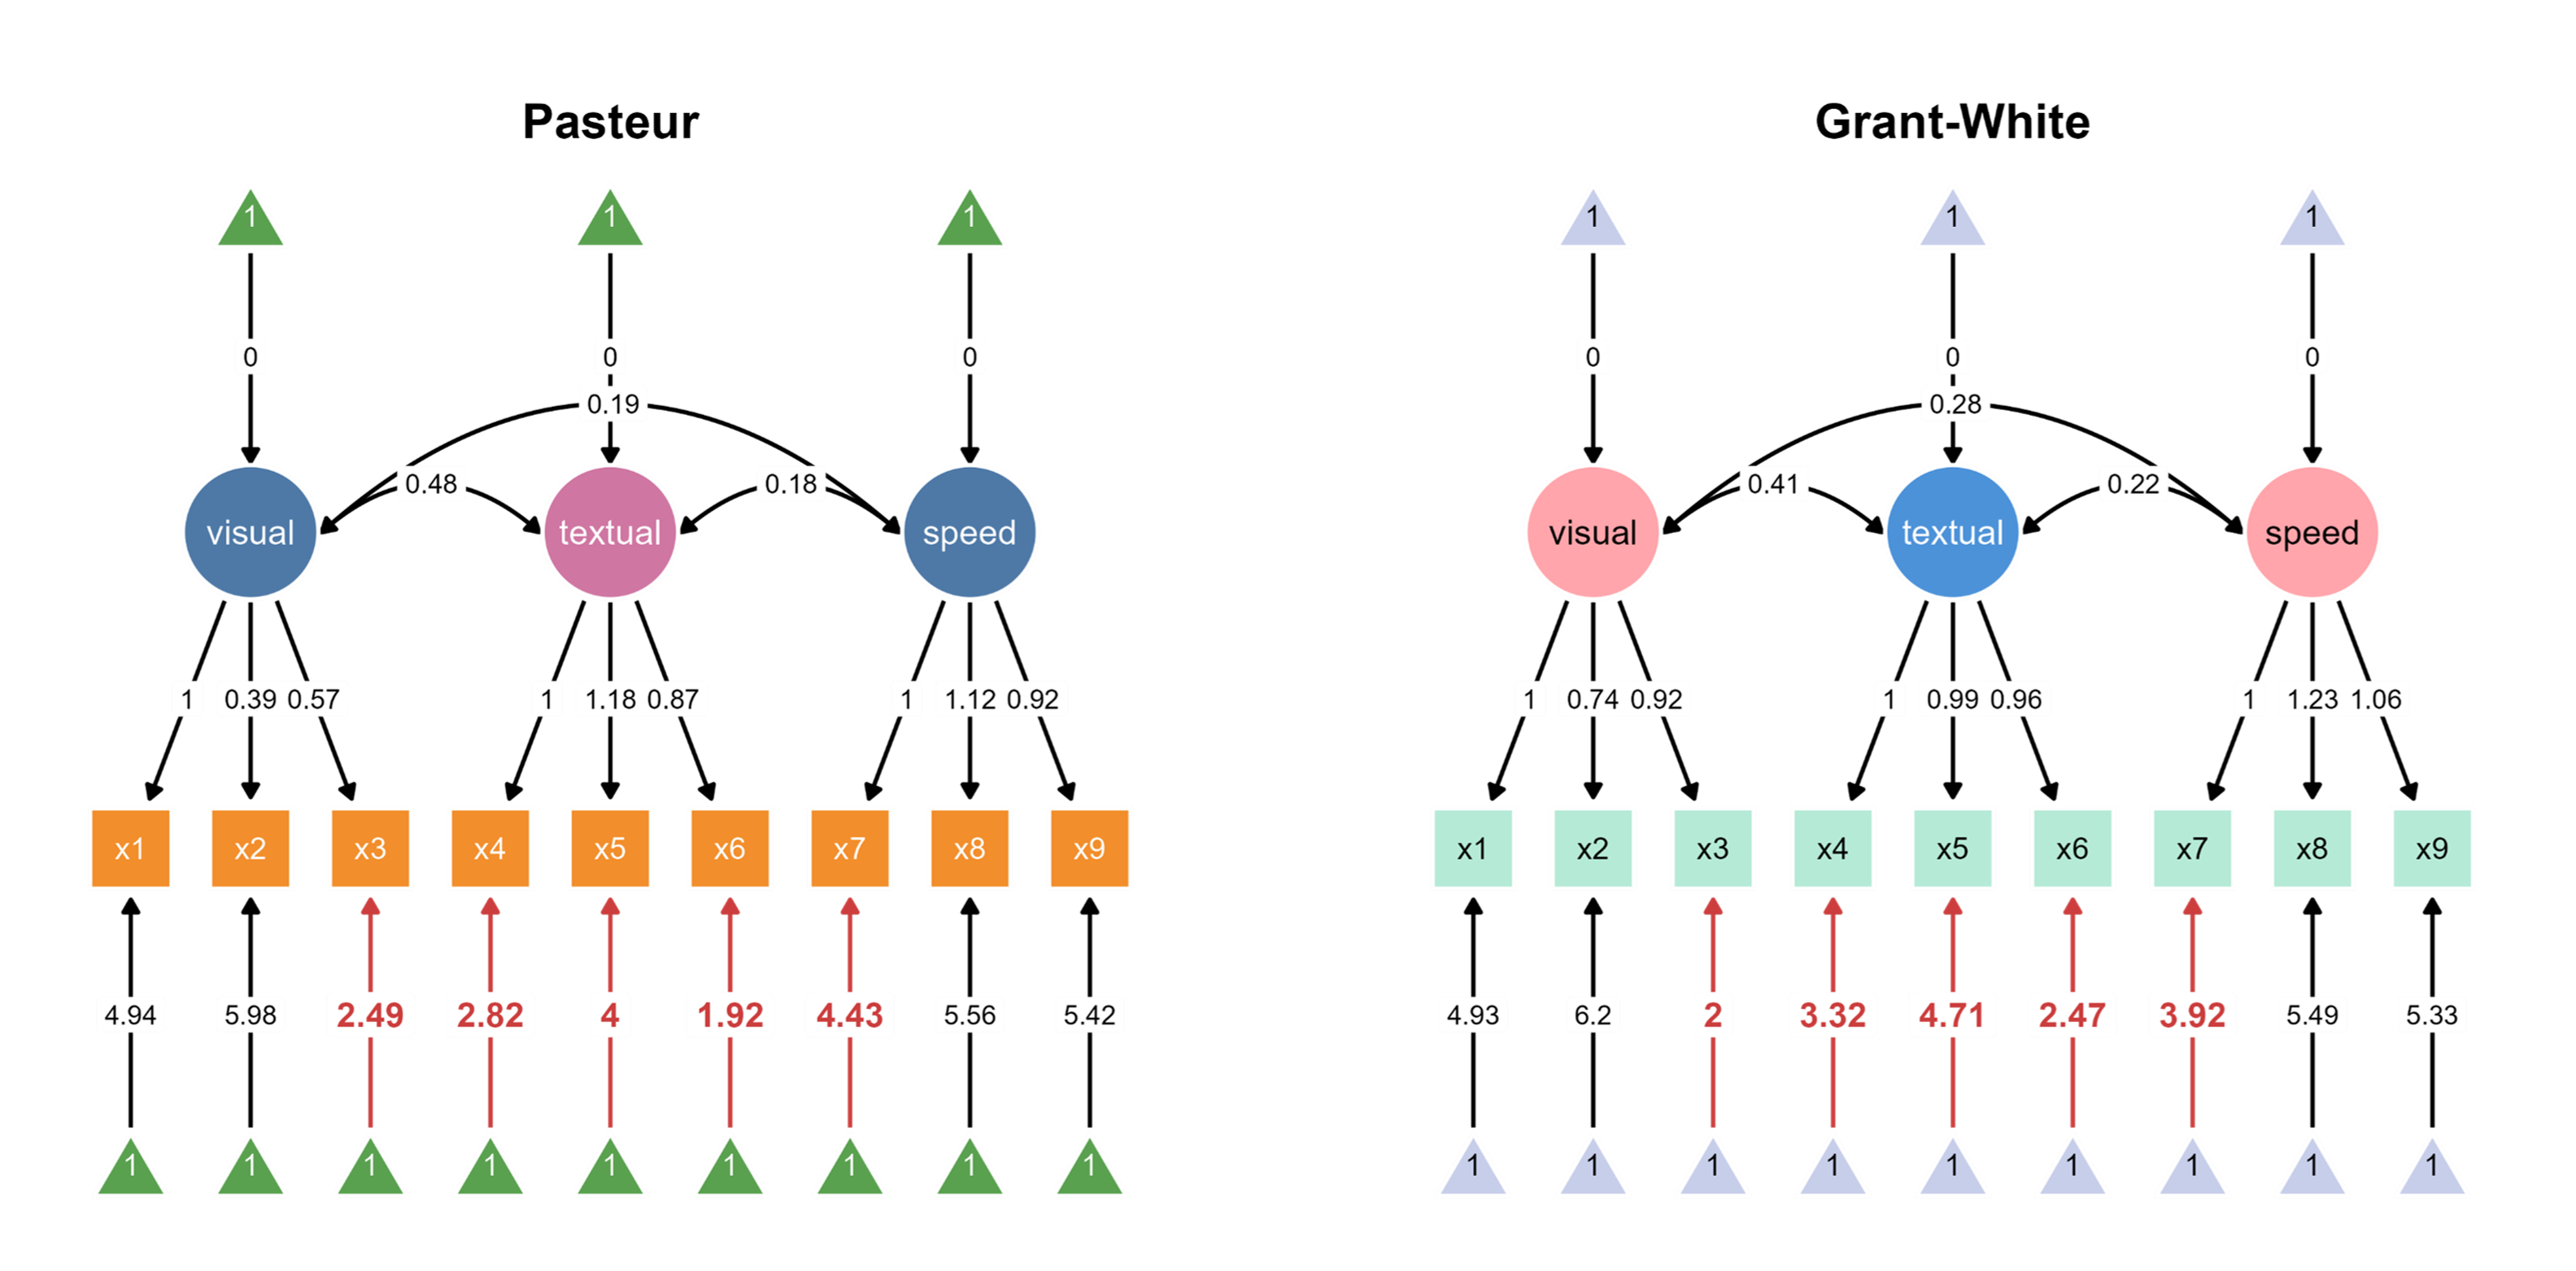
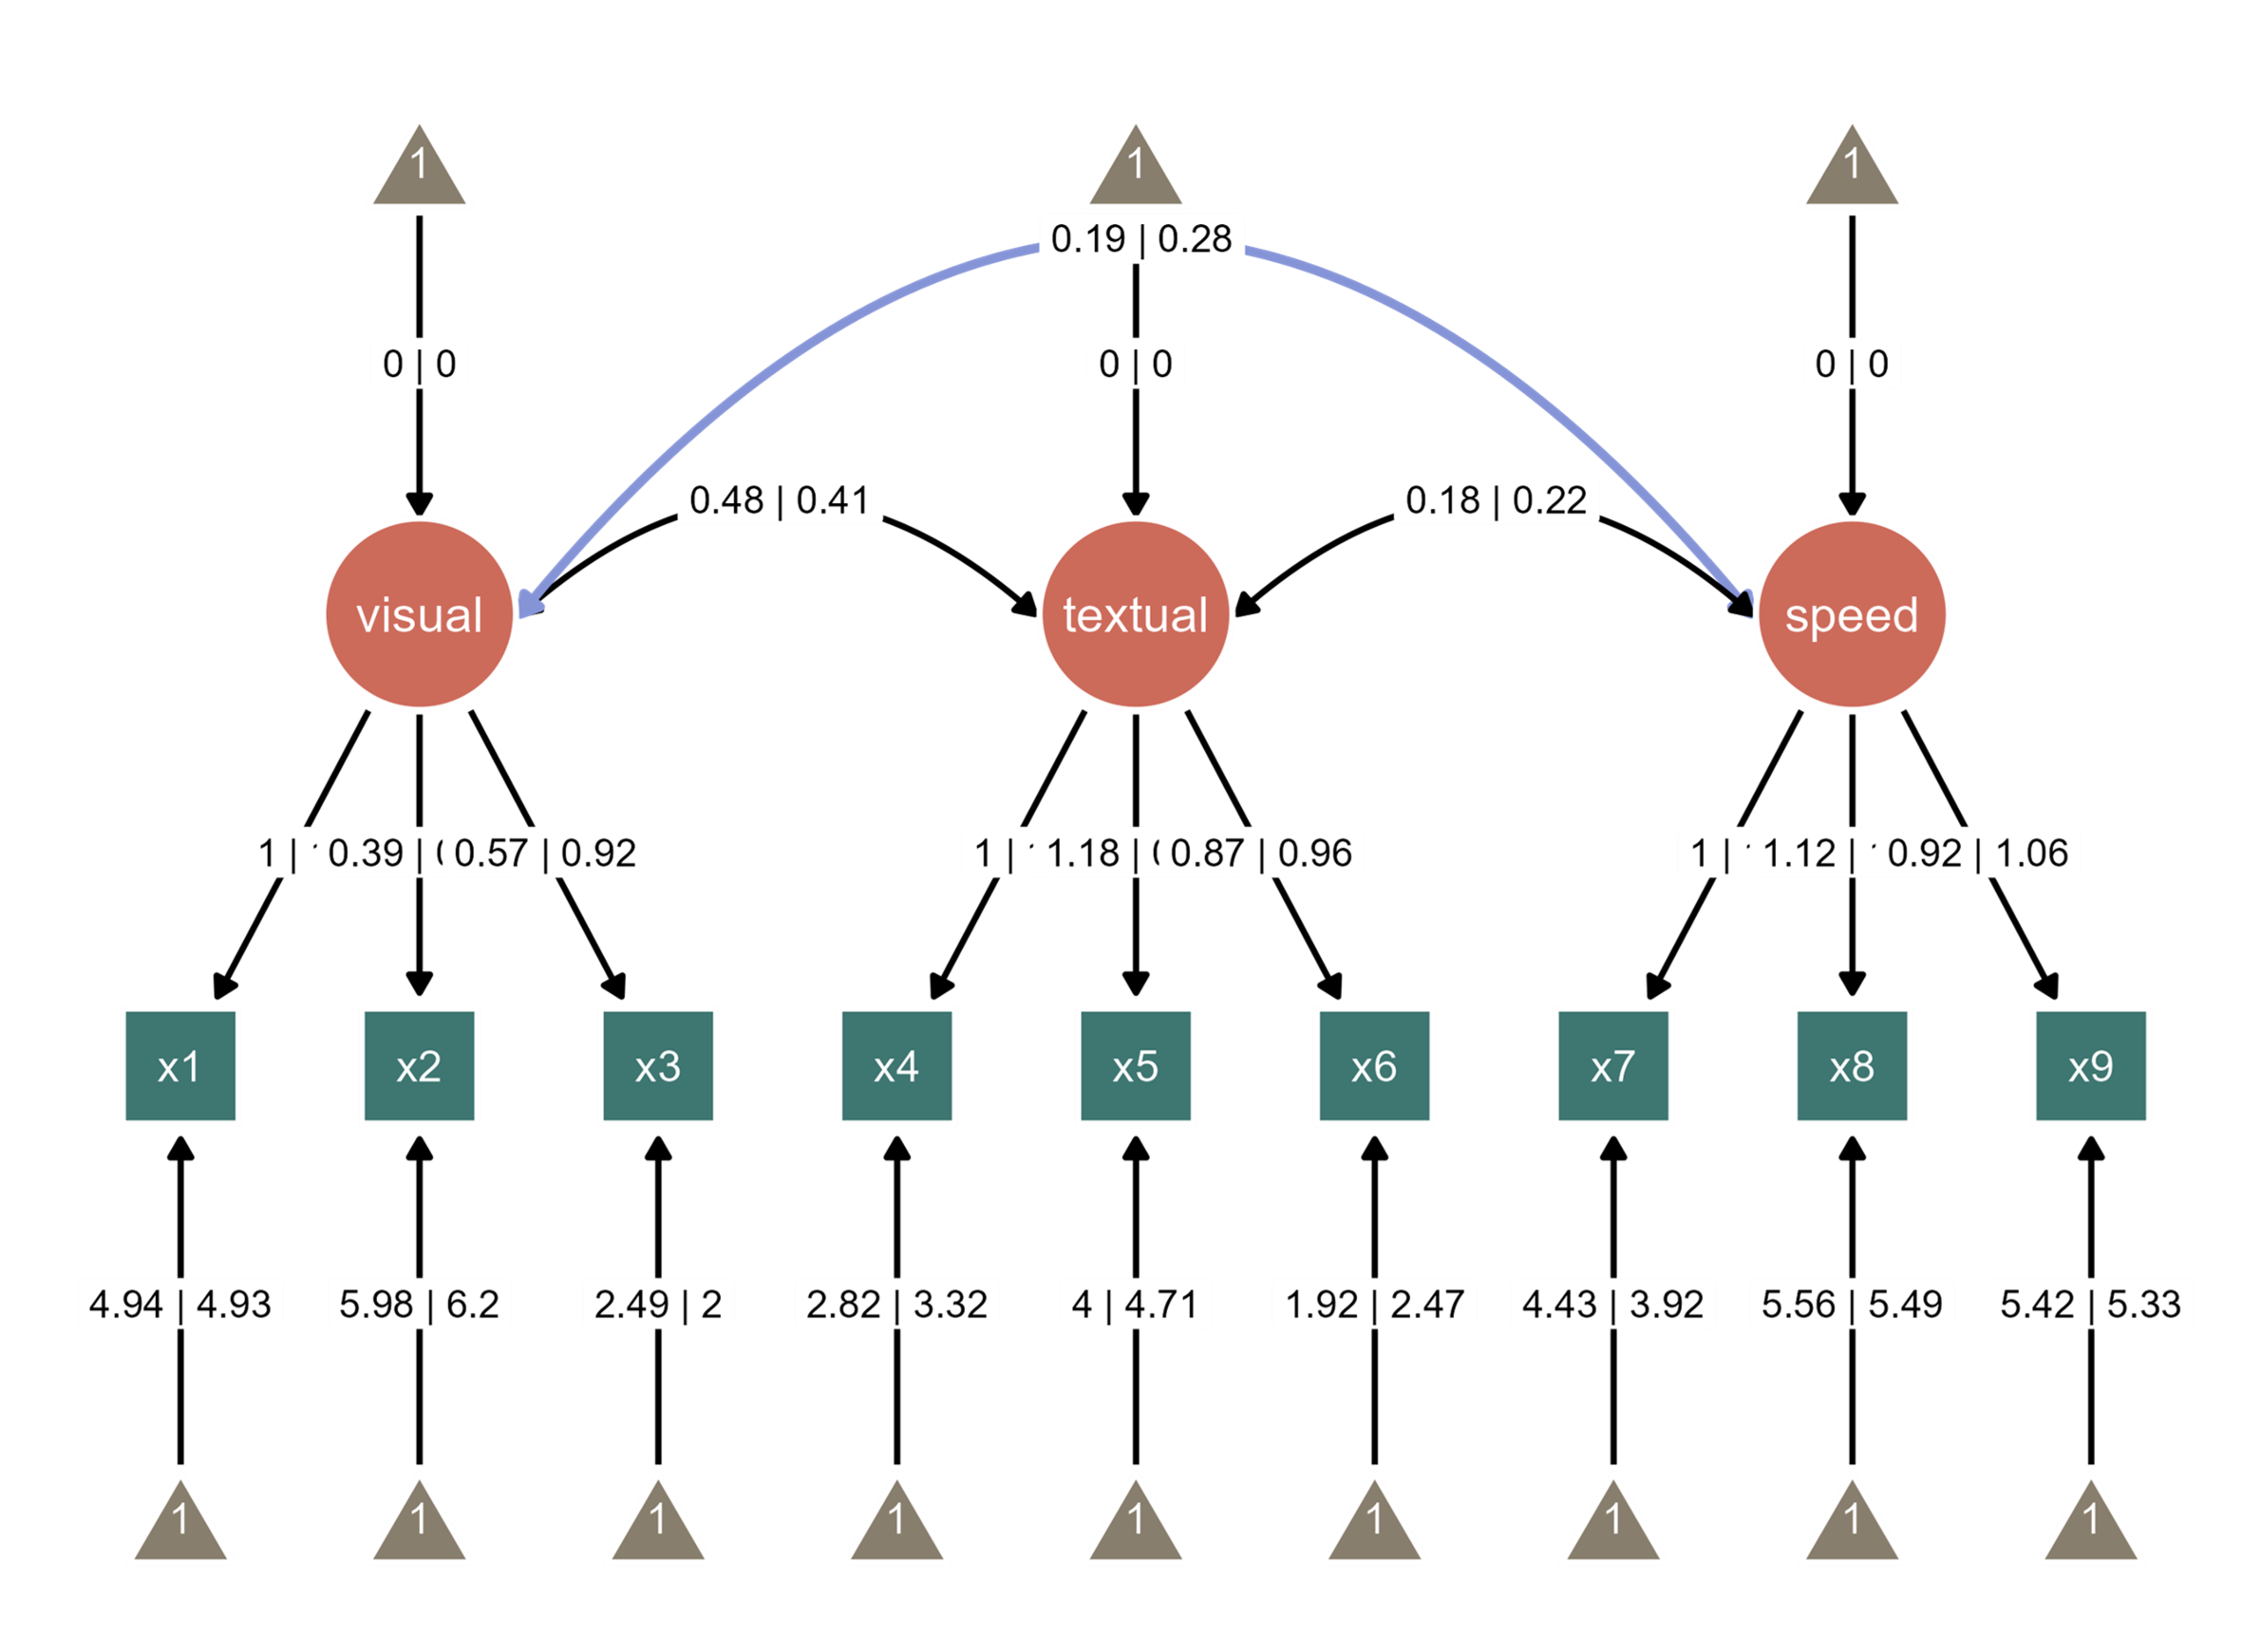
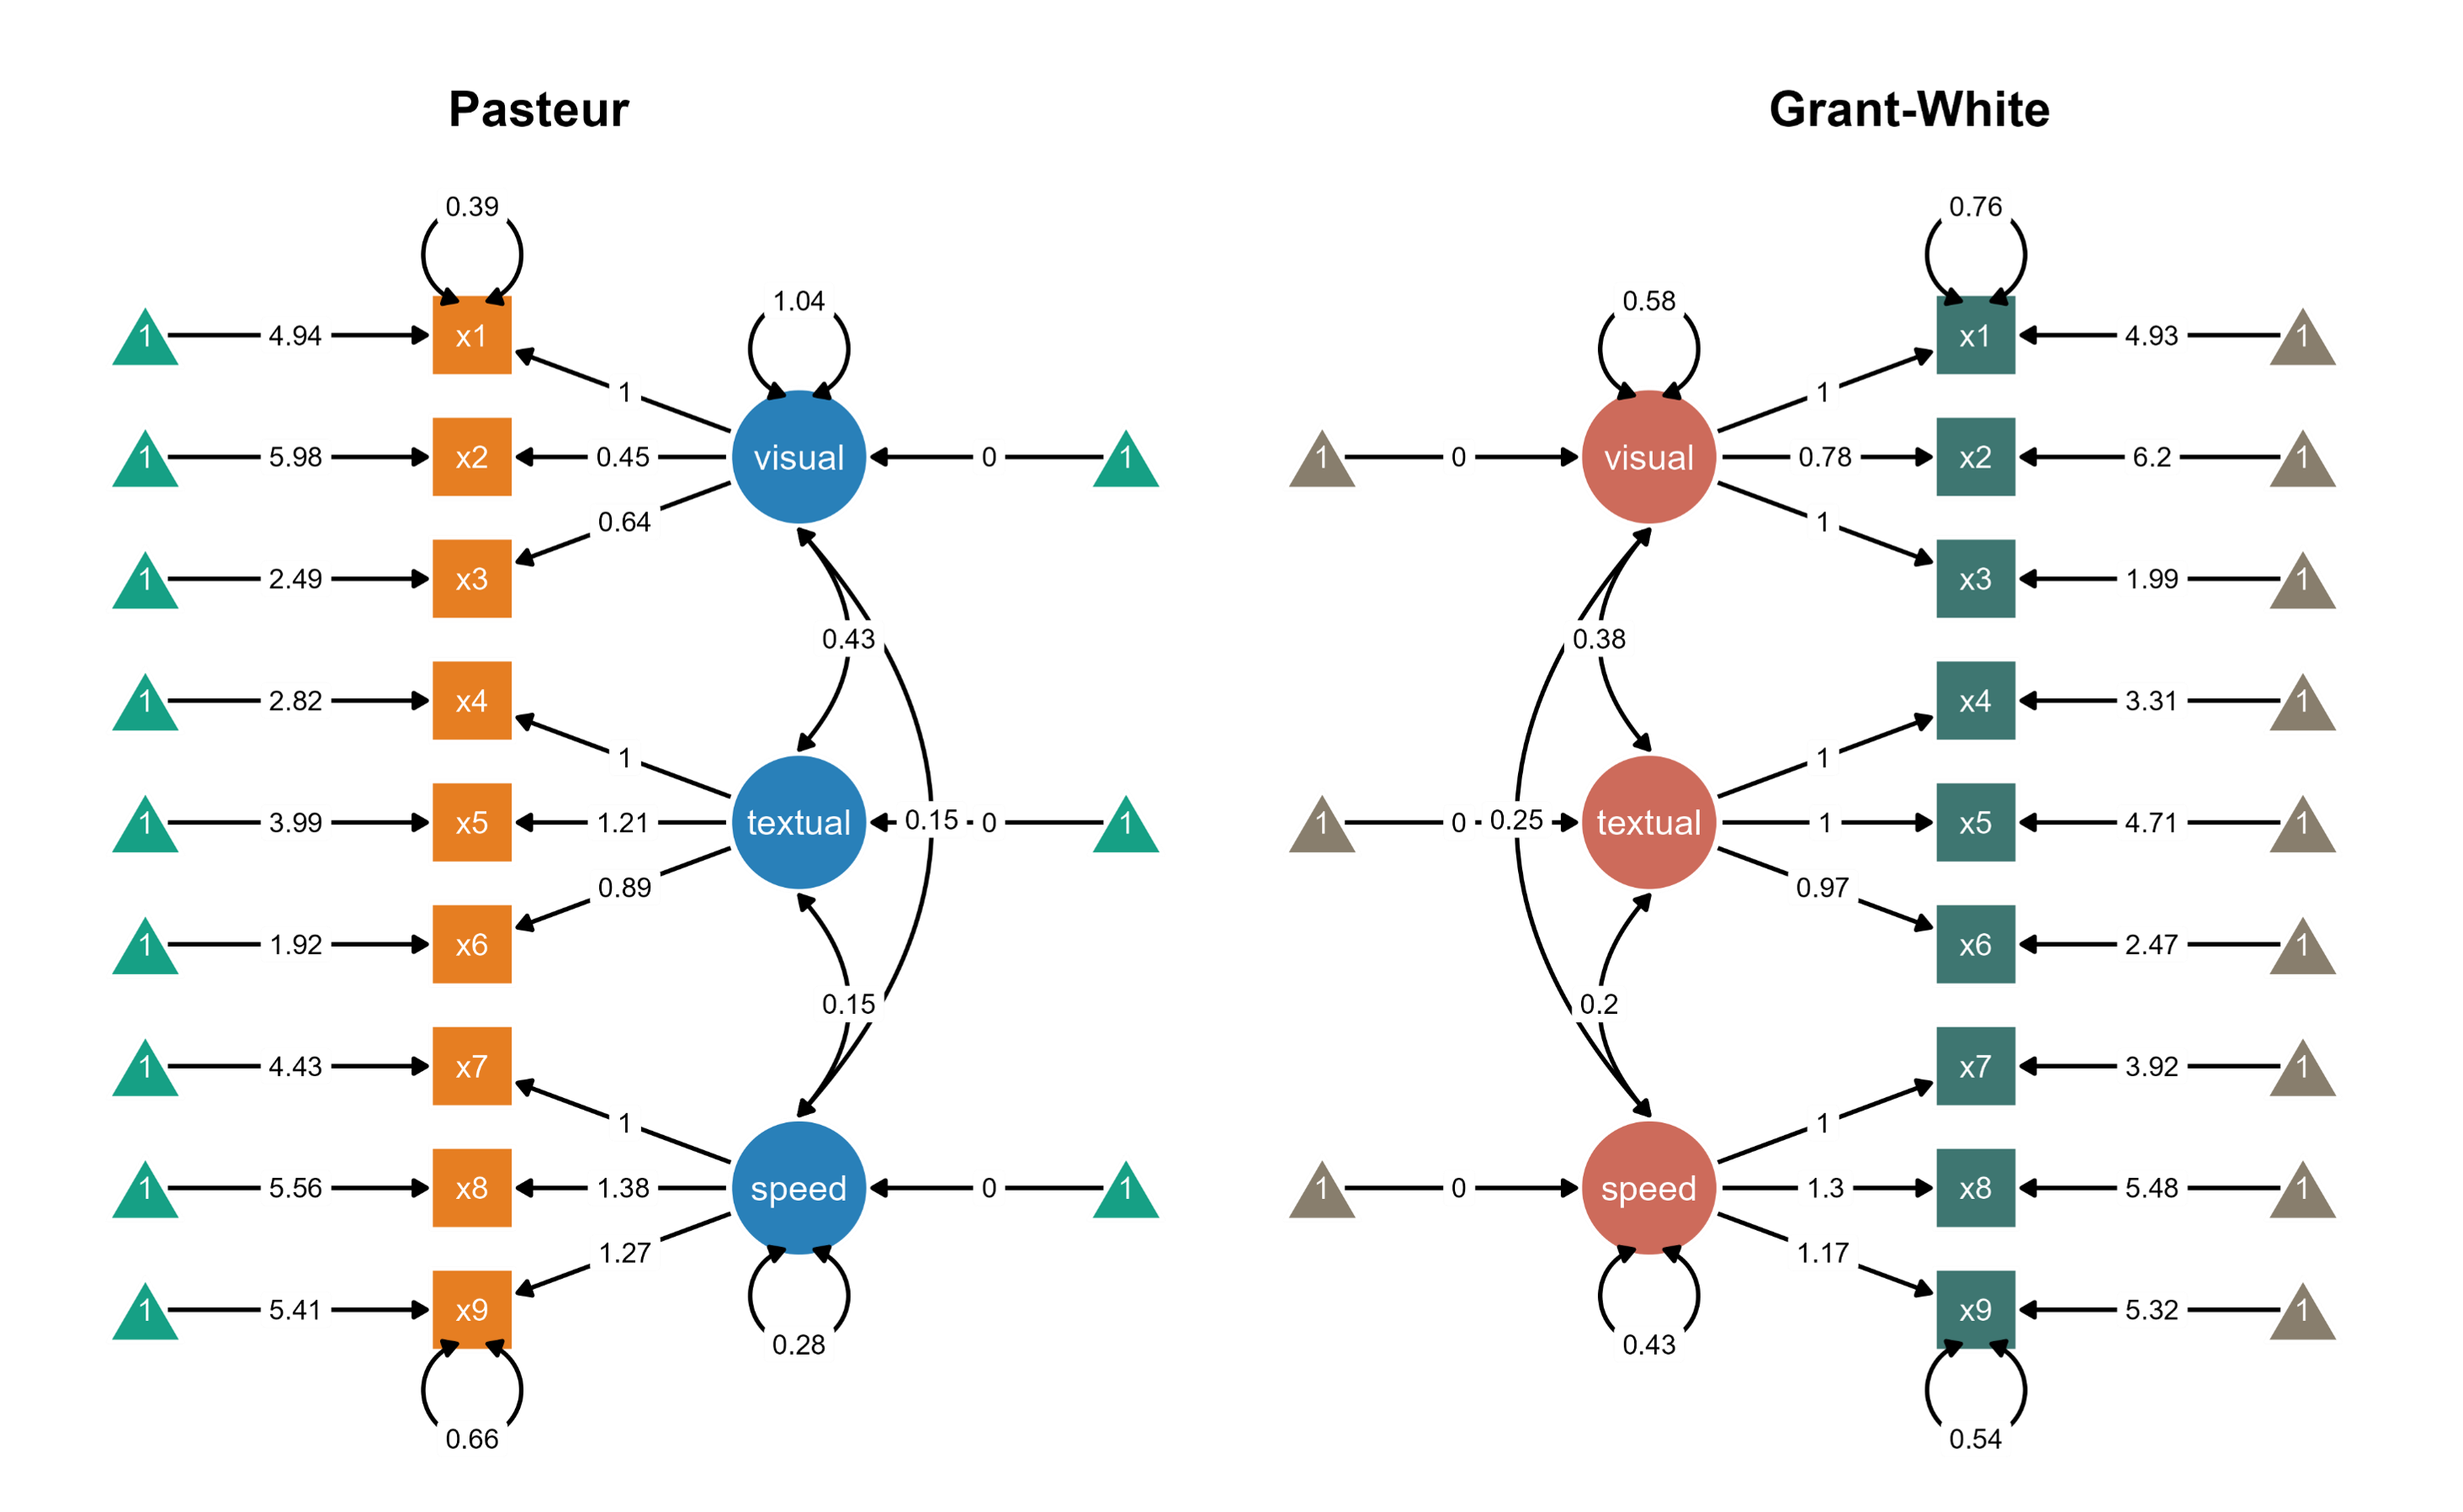
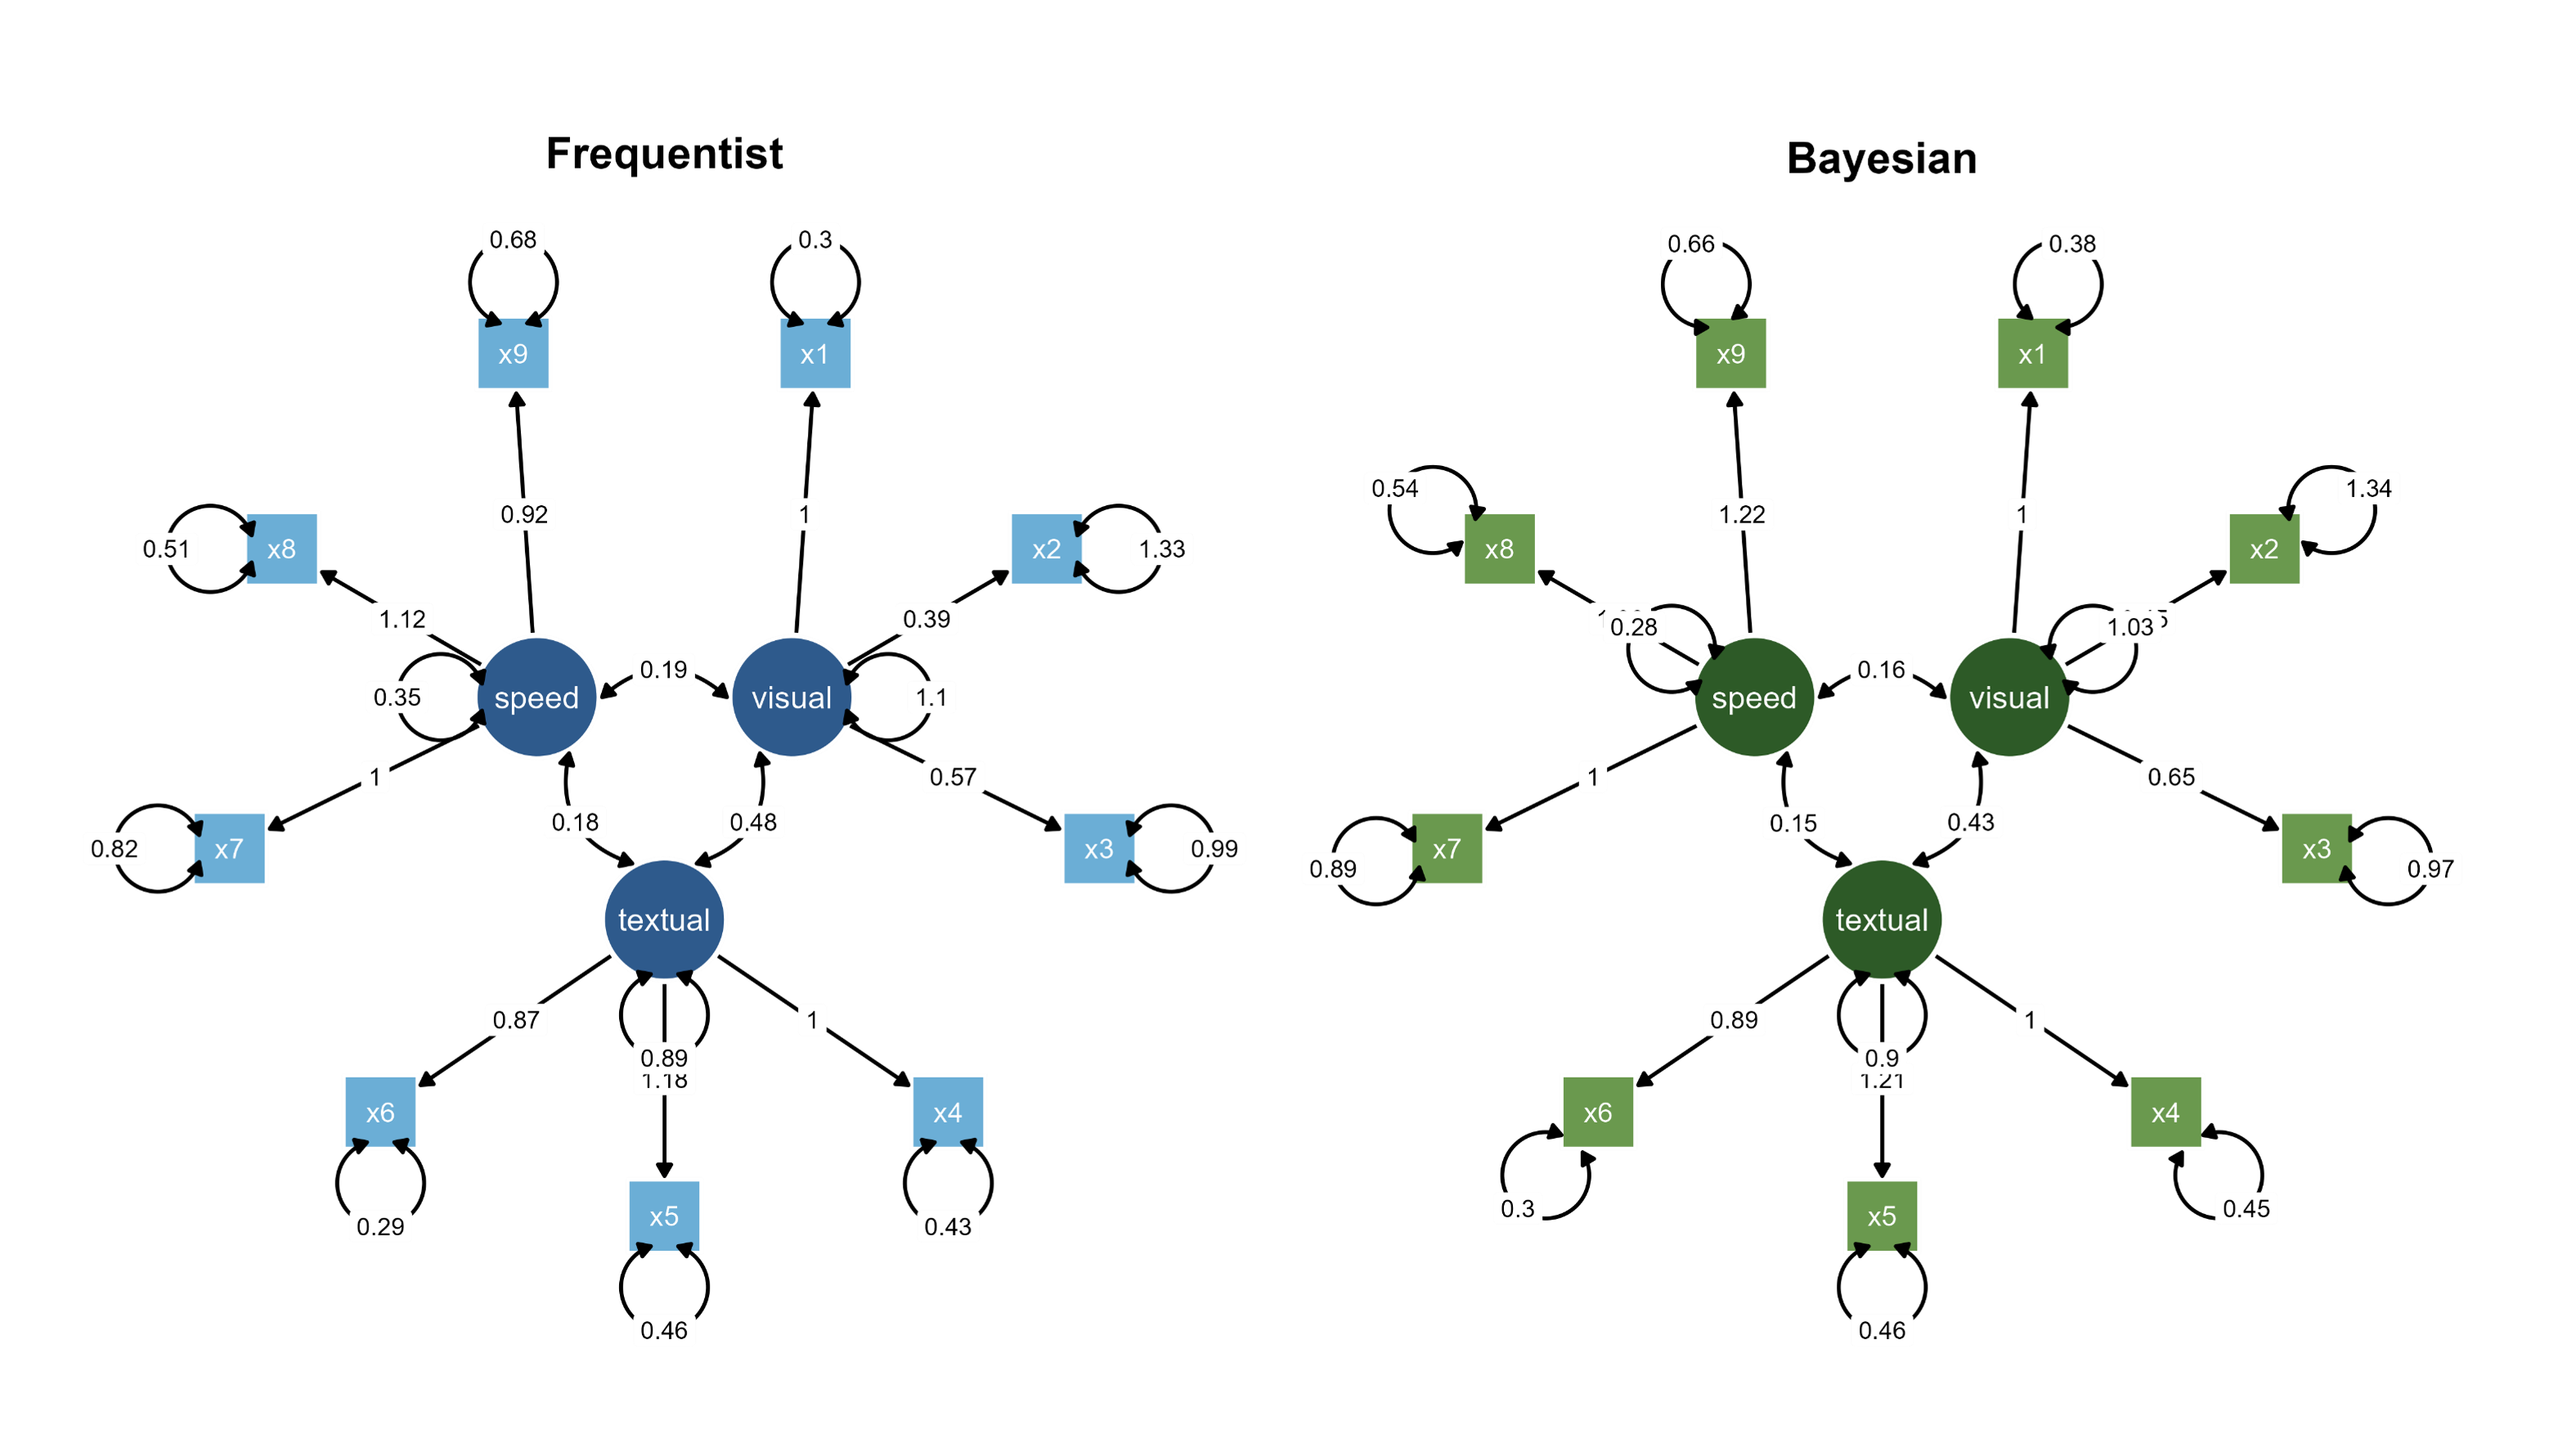
Quadratic vs. Graded options) and color palettes.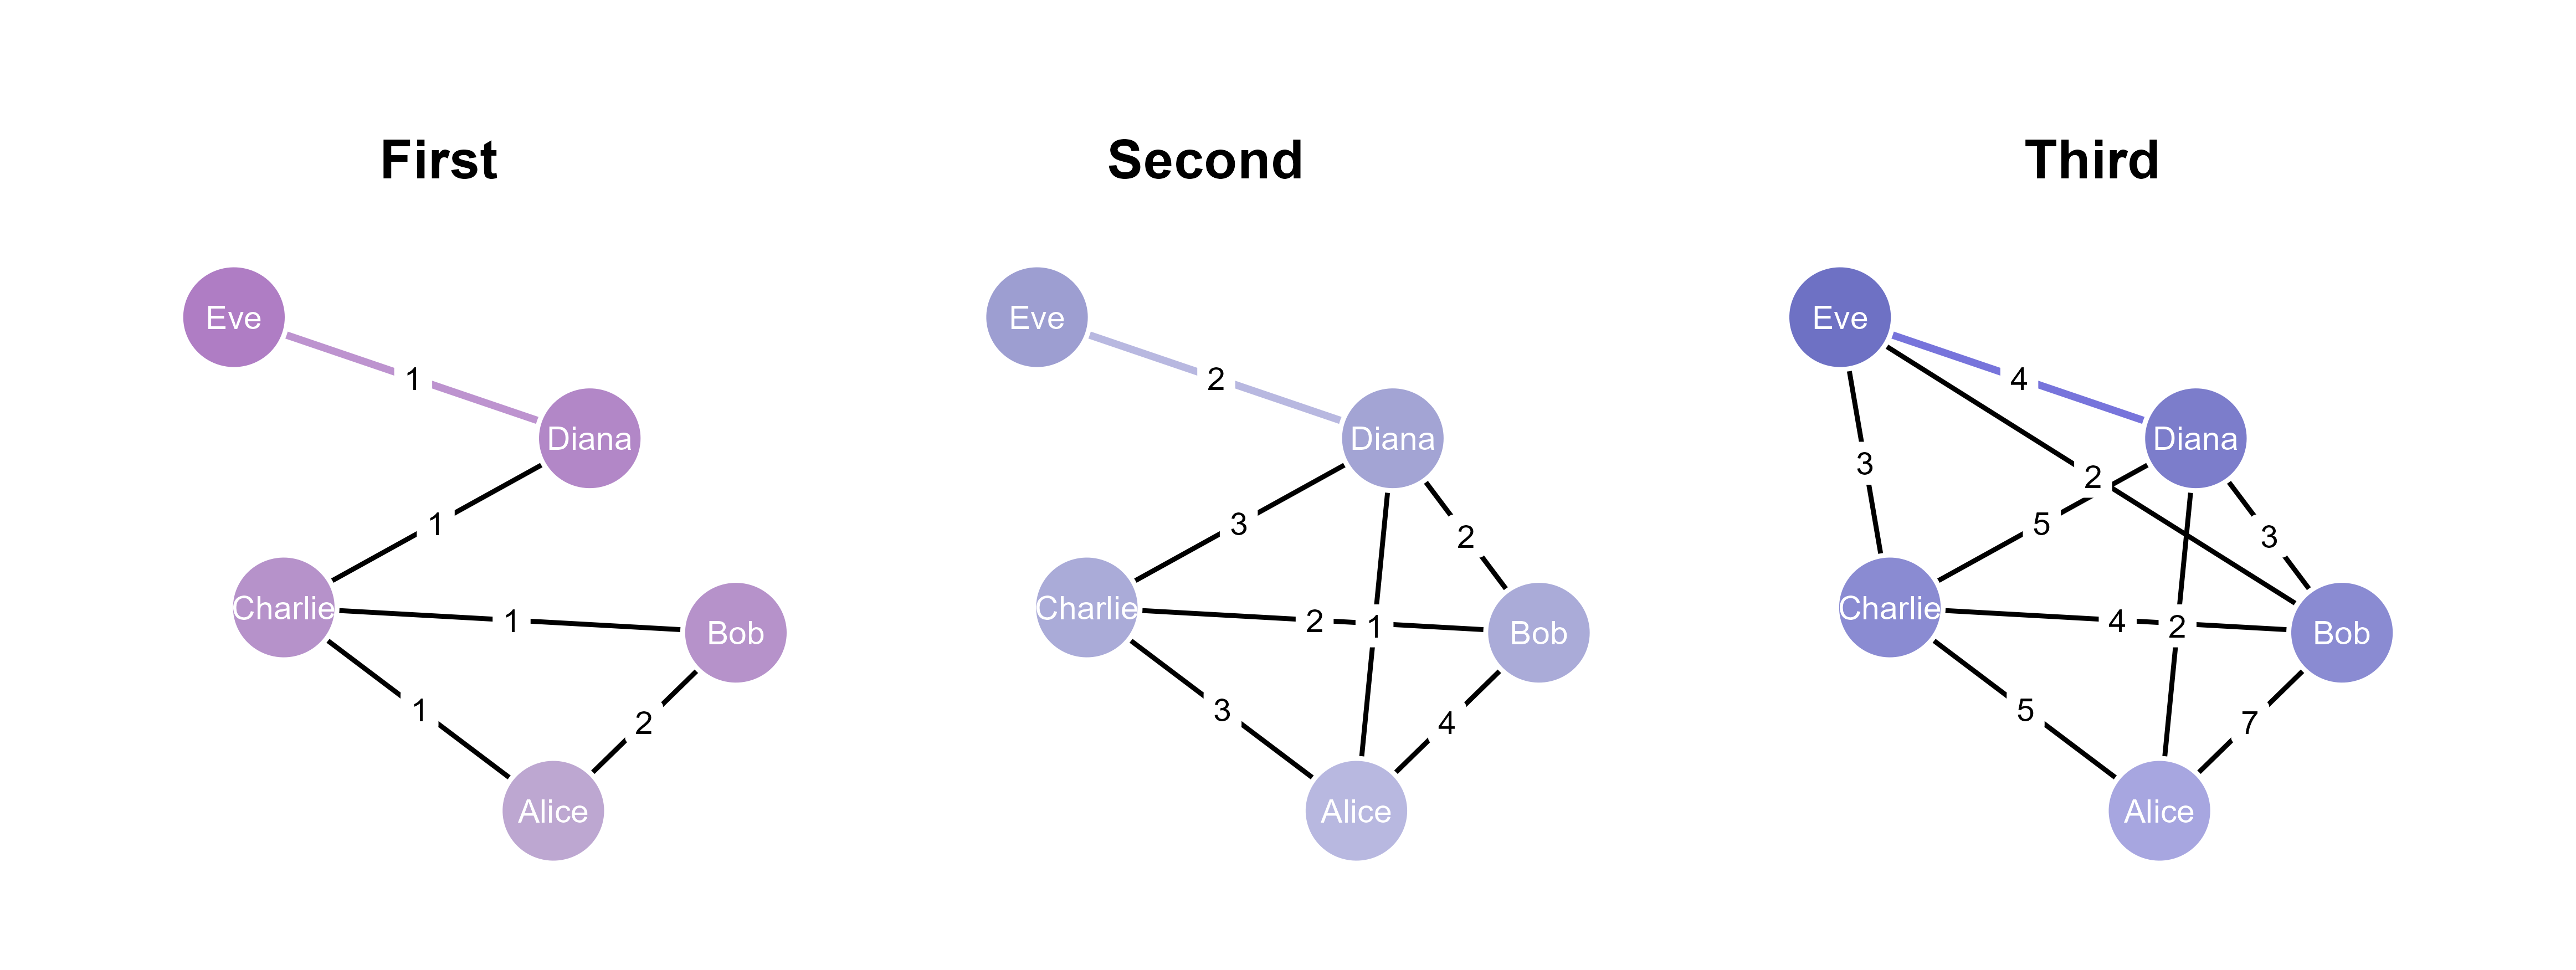
ggsem is designed for comparative visualization tasks that arise during SEM analysis. It supports side-by-side and composite multi-group SEM diagrams, single-group SEM visualization, combined multi-group labeling within a single diagram, and visualization of network models. SEMs and networks can also be displayed together in a shared visual space, enabling cross-paradigm comparison while preserving each model’s native statistical semantics.
Workflow Expansion, Not Replacement
ggsem is designed as a workflow expander rather than a replacement for existing SEM and network analysis tools. It interoperates with approximately nine object classes across thirteen established R packages, including lavaan, tidySEM, OpenMx, semPlot, and igraph.
ggsem accepts two complementary types of inputs:
- Statistical model objects (e.g., fitted models from lavaan, blavaan, or OpenMx), which provide access to estimated parameters and model structure.
- Visualization objects (e.g., layouts generated by semPlot or tidySEM), which define initial node positions and diagram geometry.
This dual-input design separates statistical estimation from visual refinement while preserving their linkage. As a result, users can:
- Start from existing fitted models created with lavaan, blavaan, OpenMx, or igraph
- Import predefined layouts from semPlot, tidySEM, lavaanPlot, or related packages
- Refine the visual presentation of path diagrams within ggsem’s interactive environment
- Export the resulting figures as native ggplot2 objects or image files for script-based workflows
- Reload saved metadata to restore or extend previous visualization states
This approach enables cross-package compatibility without requiring users to abandon their established modeling workflows.
Visualization Through Model Awareness
ggsem maintains explicit awareness of the underlying statistical model throughout the visualization process. Visual refinements therefore operate on parameter identities rather than graphical coordinates. This enables:
- Parameter-based control: Visual properties are modified by selecting model parameters (e.g., paths, loadings, residuals) rather than manually adjusting diagram elements.
- Relationship preservation: Layout adjustments respect model structure, ensuring that connected elements remain coherent during refinement.
- Statistical integration: Parameter values and statistical diagnostics can be used to guide visual emphasis, such as highlighting constrained parameters or statistically meaningful paths.
- Multi-model comparison: Composite visualizations can be constructed across groups, models, or analytical paradigms (e.g., SEM and network models) using either a single multi-group object or multiple fitted models.
This model-aware design ensures that visual distinctions correspond directly to statistical meaning rather than post-hoc graphical editing.
Complete Reproducibility
All visual refinements in ggsem are recorded as structured metadata that capture complete visualization states rather than isolated procedural steps. Each metadata file encodes the full configuration of layout, aesthetics, and parameter mappings at a given stage of exploration.
These metadata can be:
Replayed within the application to restore the interactive workspace
Converted programmatically into ggplot2 objects for scripted figure generation
Exported as publication-ready images without manual intervention
By recording visualization states rather than GUI actions, ggsem provides a reproducible link between statistical specification and visual interpretation while avoiding undocumented, manual figure editing outside R.
Installation
You can install the stable version of ggsem from CRAN:
# install.packages(c("colourpicker", "DT", "DiagrammeR", "memoise", "shiny", "shinyjs", "svglite"), dependencies = TRUE)

install.packages("ggsem") # version 0.9.9
This website was created with the development version of ggsem, which can be downloaded from Github:
devtools::install_github("smin95.com/ggsem")You can launch the app with this code below:
library(ggsem)
ggsem()
It opens a blank canvas, where you can draw diagrams in two different ways: 1) Code-free visualization, 2) Integrated Visualization.
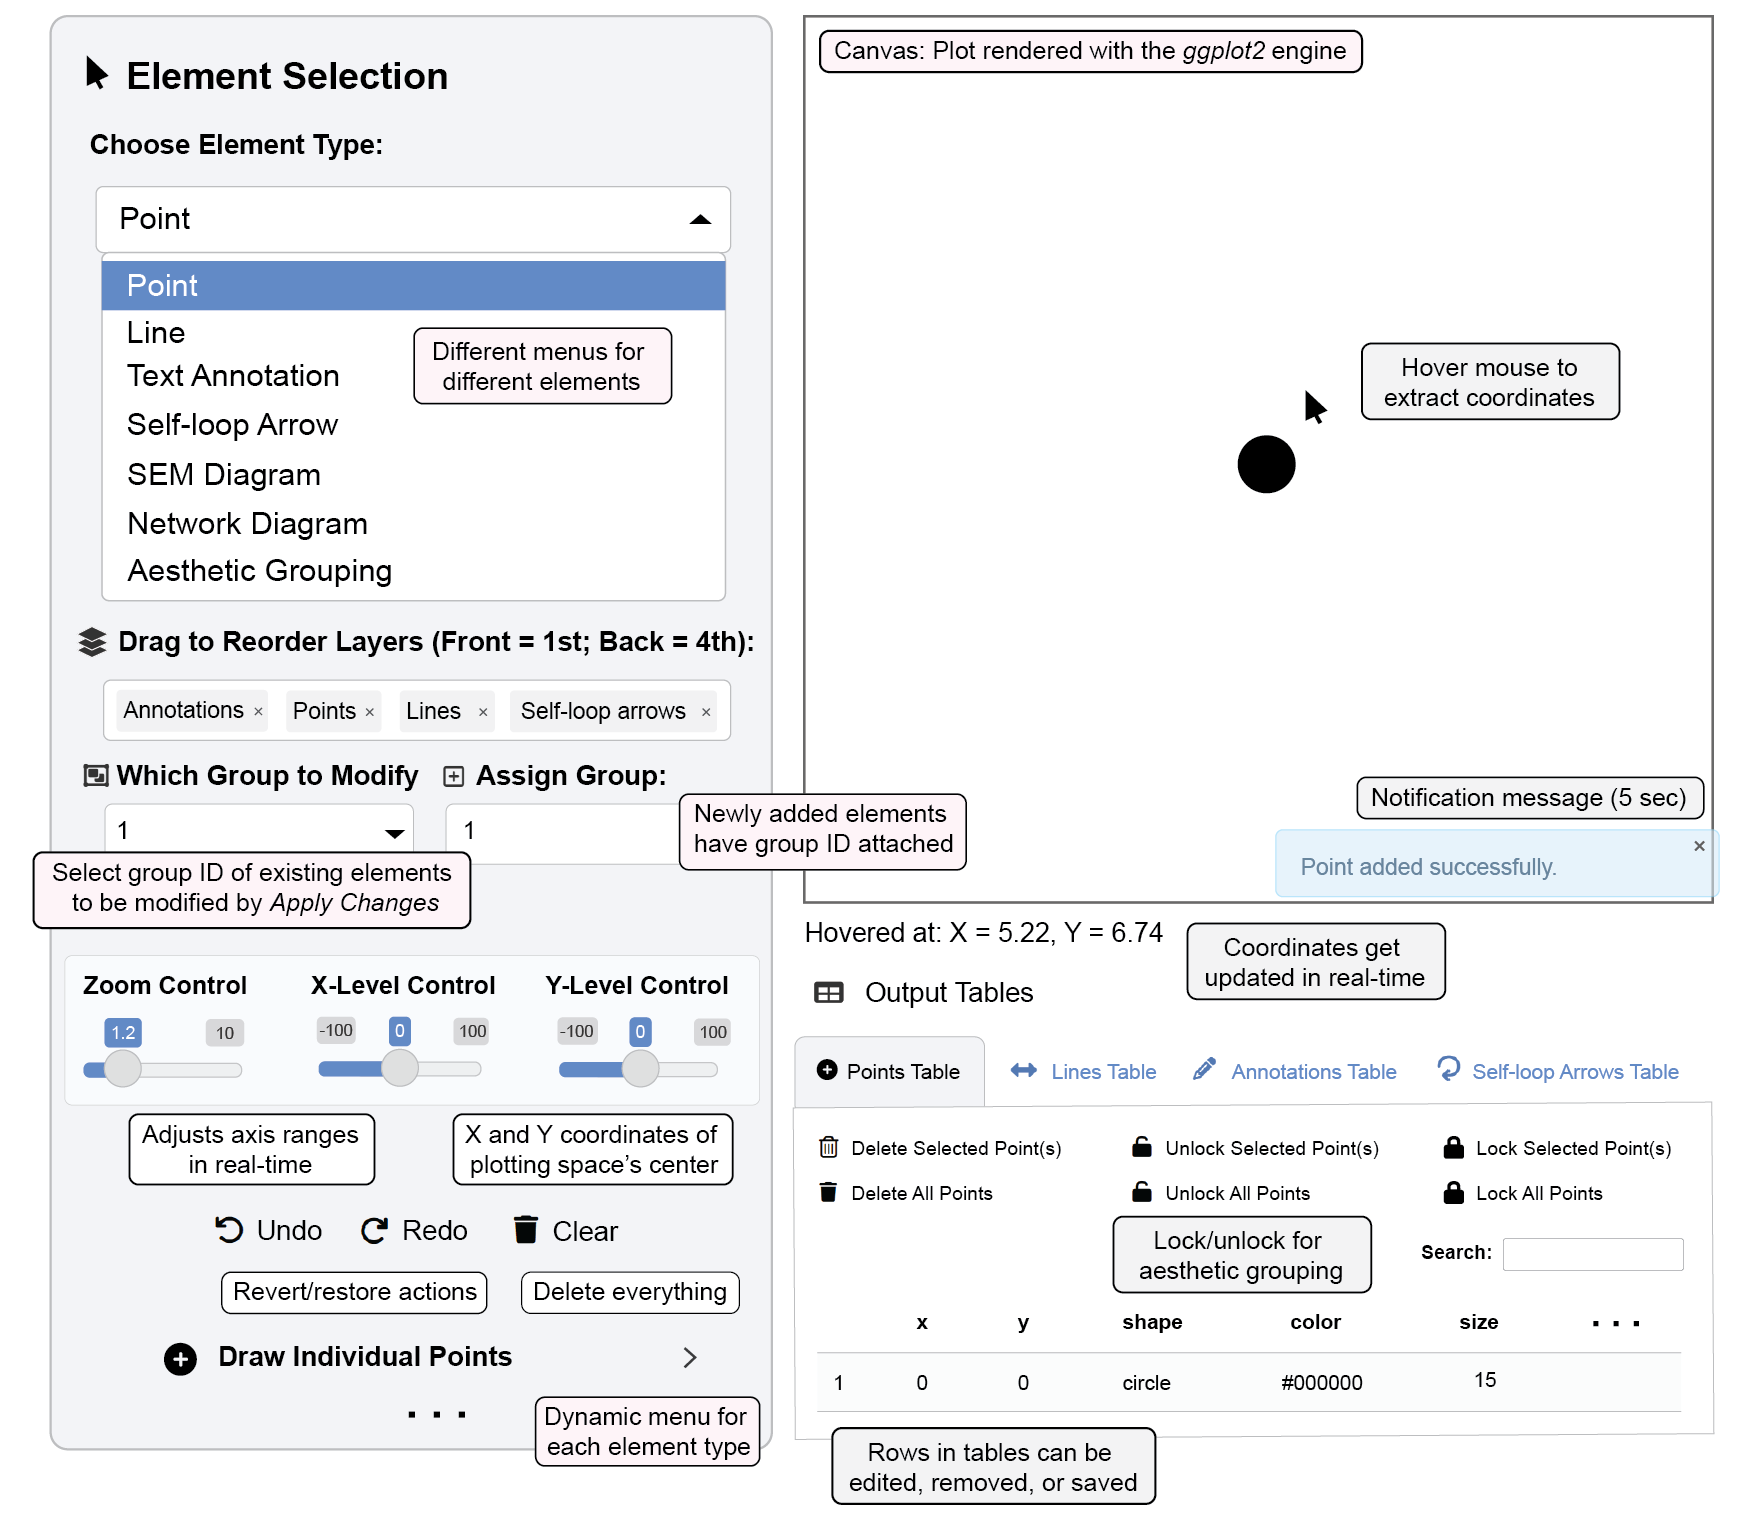
ggsem AppSEM and Network Visualizations
ggsem supports two complementary visualization workflows designed to accommodate users with different levels of programming experience and different analytical needs.:
1. Code-free Visualization: For New Users
For users without extensive R programming experience, ggsem provides a self-contained interface for constructing SEM and network diagrams directly from data and model specifications. Models can be estimated, visualized, and refined within a single environment, allowing users to produce publication-ready figures without writing custom plotting code or relying on specialized file formats.
This workflow is intended to lower the barrier to creating structured, reproducible visualizations while preserving the statistical integrity of the underlying models.
2. Integrated, Script-Based Visualization
For advanced users, ggsem functions as a workflow enhancer rather than a standalone modeling tool. Pre-existing statistical models and visualization objects created with established R packages can be imported into ggsem for interactive refinement. This allows researchers to retain their preferred estimation pipelines while using ggsem exclusively for visualization and figure preparation.
In this workflow, statistical models are estimated externally, and ggsem operates only on fitted objects and layout specifications without changing the model.
Loading Pre-existing SEM and Network Objects
ggsem provides direct integration with a range of established R packages, allowing users to begin visualization from fitted models or pre-defined layouts rather than re-estimating models inside the application.
Supported Object Types
SEM Objects (More Info on Chapter 8):
lavaan: Fitted SEM / CFA models, including single-group and multi-group specifications.blavaan: Fitted Bayesian SEM / CFA models, including single-group and multi-group specificationssemPlot: Visualization objects (of classqgraph) generated fromlavaanorblavaanmodels, and customized layouts fromsemptoolspackage.tidySEM: Single or multi-groupsem_graphobjects, including customized layouts.OpenMx:MxRAMModelobjects, including single- and multi-group models.- Note:
OpenMxmodels are internally translated to an equivalentlavaanrepresentation for visualization.
- Note:
umx: Model outputs created usingumx, viaOpenMxcompatibilityMplus:mplusObjectmodels imported viaMPlusAutomation.- Note: These models are internally translated to
lavaanobjects for rendering.
- Note: These models are internally translated to
lavaanPlot:grVizobjects created usingdiagrammeRthrough thelavaanPlotpackage.
Network Objects (More Info on Chapter 9):
igraph: Network objects created using theigraphpackage.network: Objects from thenetworkpackage.qgraph: Network objects created withqgraph(excluding SEM-styleqgraphobjects).
This design allows heterogeneous model outputs—SEM and network-based—to be visualized within a shared, reproducible framework while preserving each package’s native statistical interpretation.