This function overlays lines or arrows to a ggplot object based on line data. It supports straight lines, curved lines, gradient color transitions, and one-way or two-way arrows. The data can come from a CSV file generated by the ggsem Shiny app or custom input.
Arguments
- p
A ggplot object to which the lines will be added.
- lines_data
A data frame containing line information. The expected columns include:
x_start,y_start: Starting coordinates of the line.x_end,y_end: Ending coordinates of the line.ctrl_x,ctrl_y: Control points for curved lines (optional).type: Type of line ("Straight Line","Curved Line","Straight Arrow", or"Curved Arrow").color: Start color of the line (hexadecimal color code).end_color: End color of the line for gradients (hexadecimal color code).color_type:"Gradient"for gradient lines, or"Single"for solid-colored lines.gradient_position: Position of the gradient transition along the line (numeric, 0 to 1).width: Width of the line (numeric).alpha: Transparency of the line (numeric, 0 to 1).arrow: Logical, whether an arrowhead is used.arrow_type: Type of arrow ("open","closed", etc.).arrow_size: Size of the arrowhead.two_way: Logical, whether the line has two arrowheads (bidirectional).line_style: Line style ("solid","dashed", or"dotted").
- zoom_level
Numeric. Adjusts the size of line widths and arrowheads relative to the plot. Default is
1.- n
Integer. Number of points for interpolation in gradient or curved lines. Default is
100.
Examples
library(ggplot2)
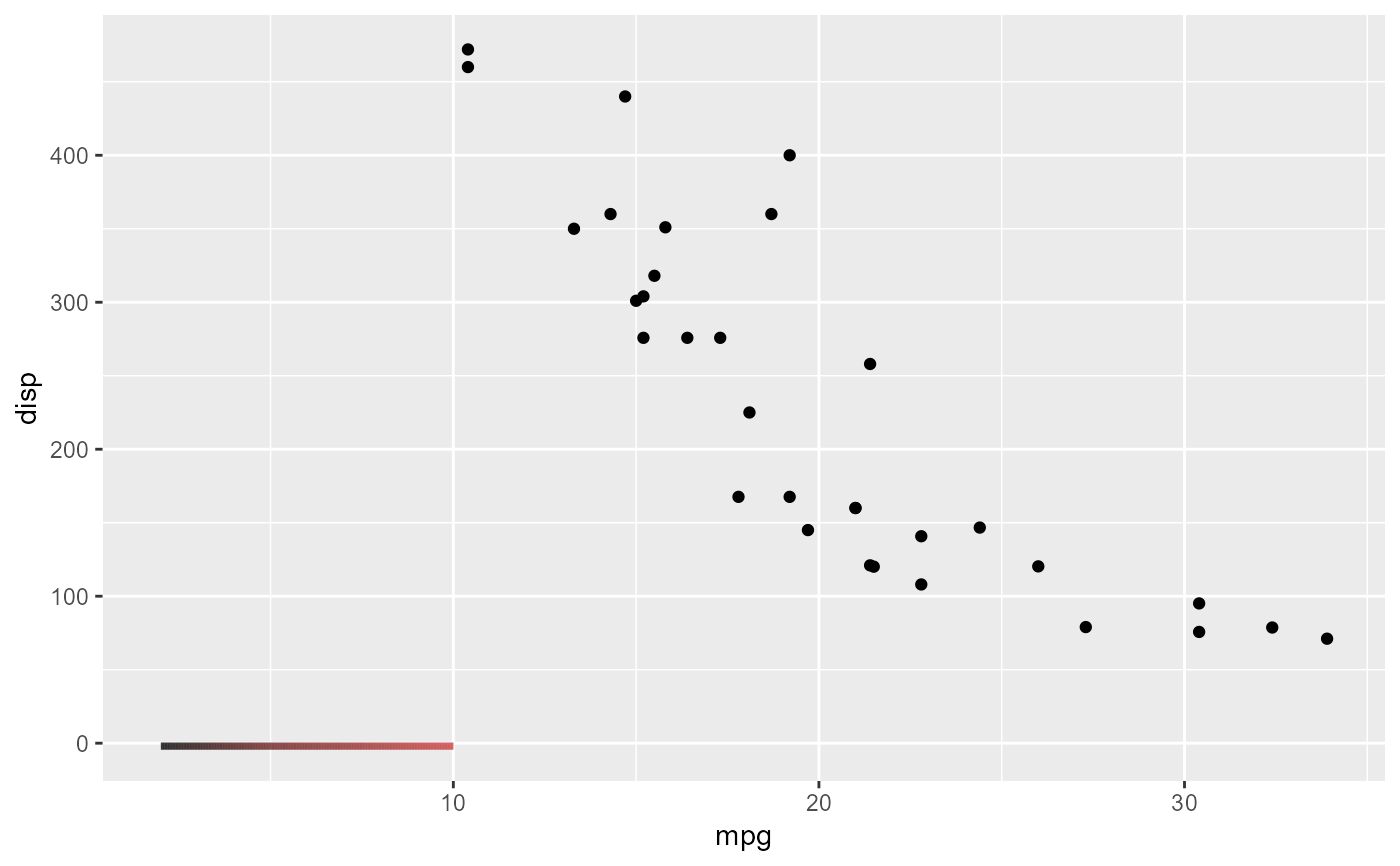
lines_df <- data.frame(
x_start = 2, y_start = -2, x_end = 6, y_end = -2, ctrl_x = NA, ctrl_y = NA,
type = 'Straight Line', color = '#000000', end_color = '#cc3d3d', color_type = 'Gradient',
gradient_position = 0.35, width = 1.5, alpha = 1, arrow = FALSE,
arrow_type = NA, arrow_size = NA, two_way = FALSE, lavaan = FALSE,
network = FALSE, line_style = 'solid', locked = FALSE
)
p <- ggplot()
draw_lines(p, lines_data = lines_df, zoom_level = 1.2, n = 200)