Convert CSV Files (from ggsem Shiny App) to a ggplot Object
Source:R/csv_to_ggplot.R
csv_to_ggplot.RdThis function converts the CSV files exported from the ggsem Shiny app into a customizable ggplot object. The resulting plot is compatible with ggplot2 functions, allowing users to modify it further (e.g., adding titles or annotations).
Usage
csv_to_ggplot(
  points_data = NULL,
  lines_data = NULL,
  annotations_data = NULL,
  loops_data = NULL,
  element_order = c("lines", "points", "self_loops", "annotations"),
  zoom_level = 1.2,
  horizontal_position = 0,
  vertical_position = 0,
  n = 100
)
Arguments
- points_data
A data frame containing point data exported from the ggsem Shiny app. Default is
NULL.- lines_data
A data frame containing line data exported from the ggsem Shiny app. Default is `NULL`.
- annotations_data
A data frame containing text annotation data exported from the ggsem Shiny app. Default is
NULL.- loops_data
A data frame containing self-loop arrow data exported from the ggsem Shiny app. Default is
NULL.- element_order
A character vector specifying the order in which graphical elements are added to the plot. For example:
c("lines", "points", "self_loops", "annotations"). Later elements appear on top. Default includes all elements.- zoom_level
A numeric value controlling the zoom level of the plot. A value >1 zooms in; <1 zooms out. Default is
1.2.- horizontal_position
A numeric value to shift the plot horizontally. Default is
0.- vertical_position
A numeric value to shift the plot vertically. Default is
0.- n
Number of points used for interpolation in gradient or curved lines. Default is
100.
Value
A ggplot object with an axis_ranges attribute specifying the x and y axis ranges after adjustments.
Details
- The function uses `coord_fixed` to ensure square plotting space and uniform scaling. - The `element_order` parameter determines the layering of graphical elements, with later elements appearing on top. - The `axis_ranges` attribute is attached to the plot for additional programmatic access.
Examples
# CSV files from ggsem app
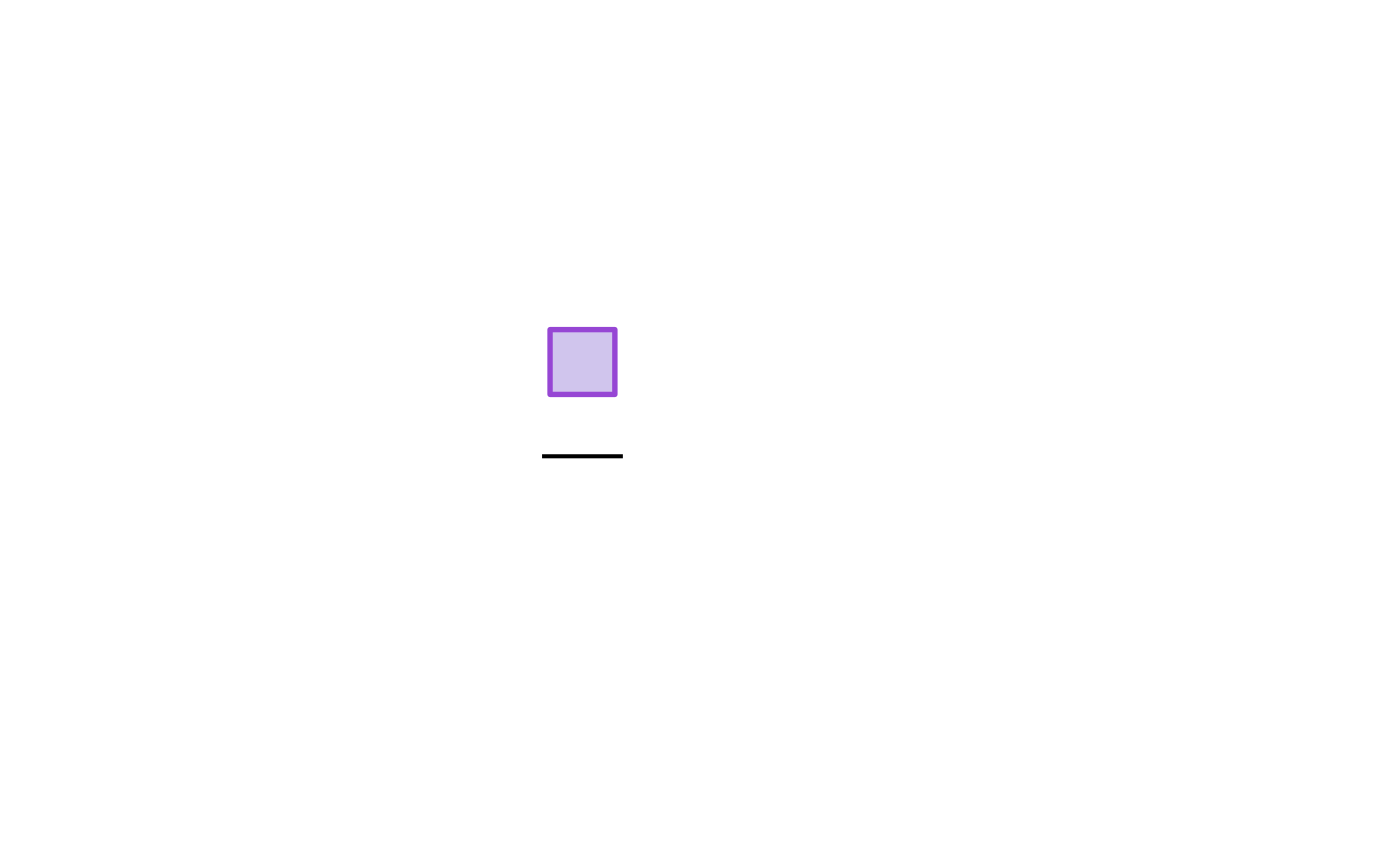
points_data <- data.frame(
x = 20, y = 20, shape = 'rectangle', color = '#D0C5ED', size = 50,
border_color = '#9646D4', border_width = 2, alpha = 1, width_height_ratio = 1.6, orientation = 45,
lavaan = FALSE, lavaan = FALSE, network = FALSE, locked = FALSE
)

lines_data <- data.frame(
x_start = 2, y_start = -2, x_end = 10, y_end = -2, ctrl_x = NA, ctrl_y = NA,
type = 'Straight Line', color = '#000000', end_color = '#cc3d3d', color_type = 'Gradient',
gradient_position = 0.35, width = 1.5, alpha = 1, arrow = FALSE,
arrow_type = NA, arrow_size = NA, two_way = FALSE, lavaan = FALSE,
network = FALSE, line_style = 'solid', locked = FALSE
)

csv_to_ggplot(points_data = points_data,
              lines_data = lines_data,
              zoom_level = 1.2, # Value from the ggsem app
              horizontal_position = 0, # Value from the ggsem app
              element_order = c('lines', 'points')) # order priority: lines < points
